Journal of Chemical Metrology
Year: 2023 Volume: 17 Issue:2 July-December
1) Simultaneous determiantion of aripiprazole and escitalopram oxalate by HPLC

Simple, accurate, precise, and sensitive reverse-phase high-performance liquid chromatographic (HPLC) method was developed for the simultaneous measurement of ARI and ESC in pharmaceutical products by using a C18 column with dimensions of 250 mm x 4.6 mm and a particle size of 5 μm. The mobile phase consisted of a mixture of acetonitrile, methanol, and water in the ratio of 80:05:15 v/v/v. Orthophosphoric acid was added to adjust the pH to 7.00 ± 0.1. The detection wavelength used for measuring the absorbance of the components was 246 nm, and the Mobile Phase flow rate was set at 1.0 mL/min. The retention times of ARI and ESC were 5.63 and 3.65 minutes, respectively. The ARI and ESC correlation coefficients (R2-values) were observed at 0.9995 and 0.9997, respectively, demonstrating a robust linear relationship between the analyte concentration and the observed absorbance. The linearity range for ARI was 20 to 120 μg/mL, while ESC was 60 to 360 μg/mL. The recovery percentages for ARI and ESC ranged from 99.43% to 100.65% and 99.58% to 100.15%, respectively. Additionally, all parameter uncertainty levels were below 2. The method was validated following ICH guideline Q2 (R1). The analytical method validated will be successfully applied to the pharmaceutical dosage form.
DOI http://doi.org/10.25135/jcm.92.2307.2830 Keywords Aripiparzaol Escitalopram HPLC method validation DETAILS PDF OF ARTICLE © 2023 ACG Publications. All rights reserved.2) A validated RP-HPLC assay method for Tofacitinib in pharmaceutical drug products
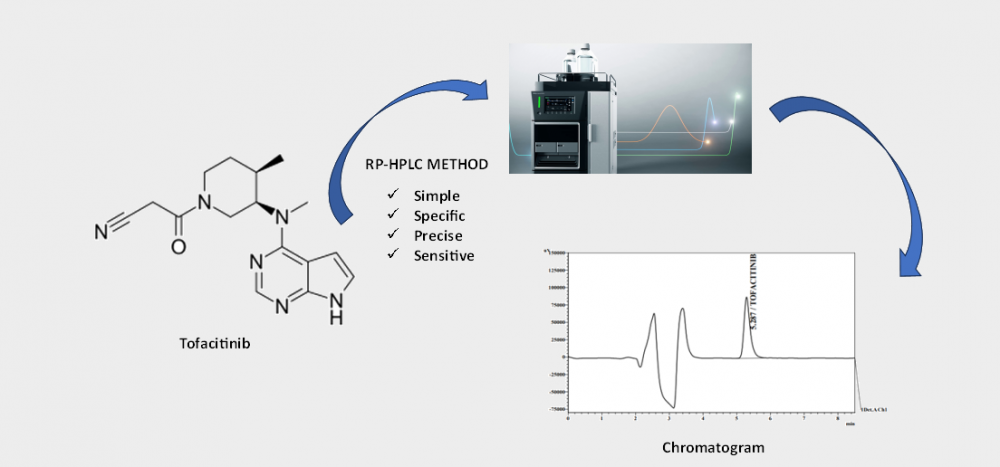
This study aimed to establish and validate a reliable RP-HPLC assay method for the quantification of tofacitinib (TFC), a janus kinase (JAK) inhibitor, in pharmaceutical formulations. The newly developed method exhibits simplicity, specificity, precision, and sensitivity. Experimental procedures utilized a Shimadzu Prominence 20A HPLC system equipped with a Inertsil ODS 3V C18 column (5µm particle size, 4.6 X 250 mm dimensions). The mobile phase, consisting of 0.05M ammonium acetate buffer at pH 5.0 and acetonitrile (65:35 v/v) in isocratic mode with a flow rate of 1.0 mL/min, facilitated accurate detection of the Tofacitinib peak at 230 nm wavelength. Comprehensive validation, including assessments of linearity, accuracy, precision, and robustness, was conducted in accordance with ICH requirements. The results demonstrated satisfaction, with a retention time (tR) of approximately 5.3 minutes. The imperative need for a swift and efficient RP-HPLC method for analyzing TFC led to the successful development and validation of this technique. Consequently, the RP-HPLC method has undergone thorough validation, establishing it as a user-friendly and trustworthy means for Tofacitinib analysis.
DOI http://doi.org/10.25135/jcm.97.2307.2859 Keywords Tofacitinib RP-HPLC tablet validation assay method DETAILS PDF OF ARTICLE © 2023 ACG Publications. All rights reserved.3) Development and validation of RP-HPLC method for estimation of Torsemide and Spironolactone in bulk and pharmaceutical dosage forms: a quality by design approach

In a Quality by Design (QbD) approach, the impact and interaction of critical variables are understood and optimized using Design of Experiment (DoE). DoE includes statistical multivariate analysis and modeling of data for continuous improvement of method. In present research work 24 full factorial design was applied to optimize and select appropriate chromatographic condition for the RP-HPLC method development of Torsemide (TOR) and Spironolactone (SPI) in synthetic mixture. The drug was analyzed using a LiChrospher® C 18 (5µm, 250×4 mm) and a mobile phase of acetonitrile: buffer (57.4:42.6 v/v) at a flow rate of 1 mL/min, with TOR showing considerable absorbance at 290 nm and SPI showing significant absorbance at 238 nm. For TOR and SPI, the technique was shown to be linear over the concentration range of 2–12 μg/mL and 10–60 μg/mL, respectively. LOD and LOQ values for TOR were 0.10 g/mL and 0.32 g/mL, respectively, whereas those for SPI were 0.75 µg/mL and 2.29 µg/mL. The correlation coefficient (R2) was found 0.9973 for TOR and 0.9976 for SPI. Recovery study for accuracy was found in the range of 97.55 % - 99.05% and 94.82%-100% for TOR and SPI respectively.
DOI http://doi.org/10.25135/jcm.94.2304.2769 Keywords Torsemide spironolactone RP-HPLC validation QbD Measurement uncertainty DETAILS PDF OF ARTICLE © 2023 ACG Publications. All rights reserved.4) In-vitro release study of Racecadotril from granule sachets: influence of Brij-35
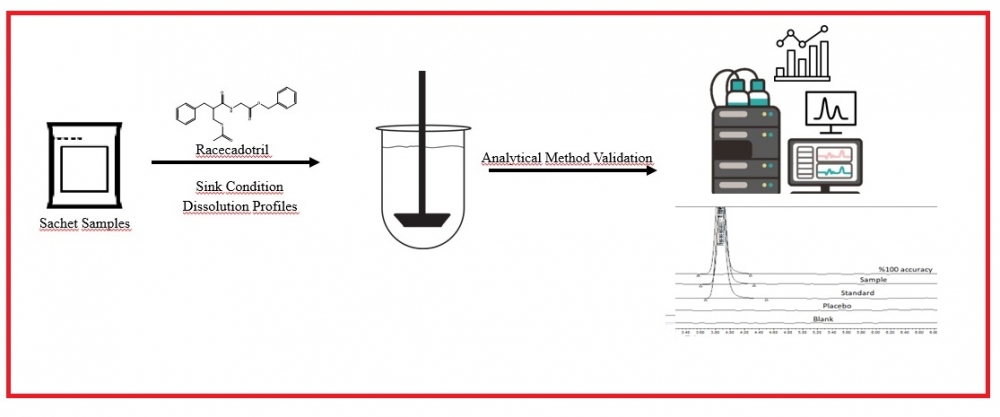
For sachet drug forms containing Racecadotril, which are freely soluble in methanol and methylene chloride but practically insoluble in water, used as an anti-diarrhea, suitable dissolution media meeting the parameters requested by the authorities are not available in the literature and monographs. For this reason, a suitable dissolution medium was determined in accordance with the guidelines and the dissolution profiles of reference product and samples used in the study. The profiles were compared, and the method was validated. In order to determine the most suitable medium for the release of drug product, in vitro dissolution tests were performed in media prepared by different buffers similar to the pH of the gastrointestinal tract (GIT) and media containing Brij 35. In this context, the effects of buffers, pH, and different surfactants were evaluated, and it was found that Polyoxyethylene 23 lauryl ether (Brij-35), a nonionic surfactant, increased the solubility. The results were obtained with RP-HPLC method using Kromasil C18 150 mm x 4.6 mm, 5 µm column with a flow rate of 1.5 ml/min at 210 nm wavelength in 7 minutes for Racecadotril, which dissolves at least 60% of the label value after 45 minutes after the dissolution studies performed with a type II apparatus at 37°C. A suitable dissolution medium was found for sachet drug forms containing Racecadotril, and the analytical method was validated in accordance with the ICH Q2 (R1) guideline. In addition, the difference factor (f1) and similarity factor (f2) were calculated to compare the dissolution profiles of the reference product and samples in this determined dissolution medium.
DOI http://doi.org/10.25135/jcm.91.2307.2837 Keywords Racecadotril dissolution medium Brij-35 dissolution Rate Validation sink condition DETAILS PDF OF ARTICLE © 2023 ACG Publications. All rights reserved.5) An effective HPLC method for evaluation of process related impurities of Letermovir and LC-MS/MS characterization of forced degradation compounds
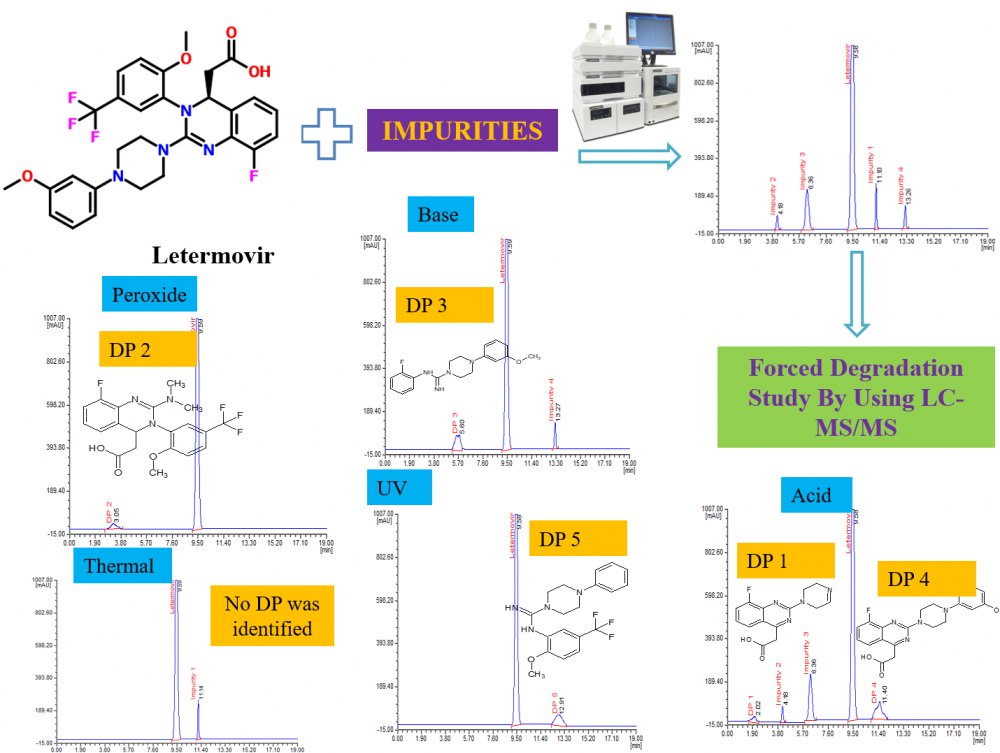
This study aimed to propose a straightforward and highly sensitive HPLC method for the evaluation of letermovir, coupled with an examination of the stress degradation nature of letermovir. Chromatographic separation analytes were attained using a Phenomenex Luna C18 column (250 mm × 4.6 mm; 5 µm id) maintained at 35 °C. The mobile phase comprises 0.1% phosphoric acid, methanol, and acetonitrile in 45:25:30 (v/v) facilitated isocratic elution at 0.8 mL/min with 234 nm wavelength. Under the proposed conditions, retention times were determined to be 9.58 min for letermovir and 11.10 min, 4.18 min, 6.30 min, and 13.26 min for impurities 1, 2, 3, and 4, respectively. The method achieved a sensitive detection limit of 0.009 with 0.05–0.2 µg/mL as the linear range for impurities. Other validation tests met acceptable criteria for letermovir and impurities. Additionally, stress degradation tests were conducted following ICH Q1A (R2) guidelines, subjecting the drug to various stress conditions. LC-MS/MS analysis identified five degradation products (DPs), of which DP 1, 4, and 5 were formed due to acid stress, whereas DP 2, 3 and 5 were formed due to peroxide, base and UV stress respectively. The possible structure of DPs was assessed by the interpretation and correlation of mass fragment data. The validation test produces satisfactory results supporting the suitability of the method for regular analysis of letermovir and its impurities. Moreover, the method is applicable for evaluating the degradation mechanism of letermovir.
DOI http://doi.org/10.25135/jcm.98.2311.2975 Keywords Letermovir impurities HPLC method optimization stress degradation products LC-MS/MS characterization DETAILS PDF OF ARTICLE © 2023 ACG Publications. All rights reserved.6) Quantification of main secondary metabolites of Satureja icarica P.H. Davis (Lamiaceae) by LC-HRMS and evaluation of antioxidant capacities
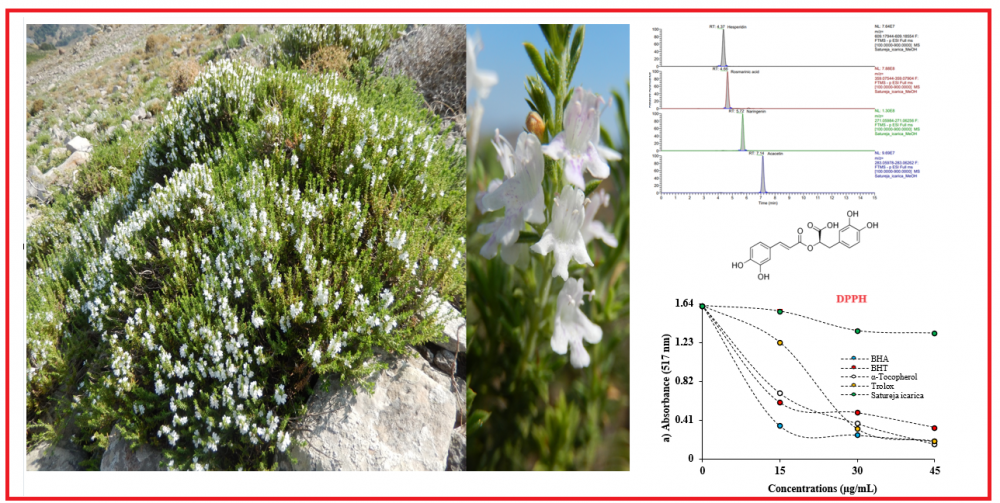
In this study, we determined antioxidant activity of Satureja icarica (Lamiaceae) which is used as a spice by the local population against 1,1-diphenyl-2-picryl-hydrazyl (DPPH·), N,N-dimethyl-p-phenylenediamine radicals (DMPD•+), and 2,2-azino-bis-3-ethylbenzthiazoline-6-sulfonic acid (ABTS•+) as well as their ability to reduce Fe3+, Fe3+-TPTZ, and Cu2+. The antioxidant activities of both extracts were similar to those of standards in all assays. For instance, IC50 of S. icarica were for scavenging DPPH was 10.19 μg/mL. The results of liquid chromatography-high resolution mass spectrometry (LC-HRMS) revealed that the main secondary metabolites in Satureja icarica were found to be as rosmarinic acid and luteolin-7-O-rutinoside.
DOI http://doi.org/10.25135/jcm.2311.2956 Keywords Satureja icarica LC-HRMS seconder metabolite antioxidat activity rosemarinic acid DETAILS PDF OF ARTICLE © 2023 ACG Publications. All rights reserved.7) Reversed phase-HPLC-PDA method for quantification of Desidustat
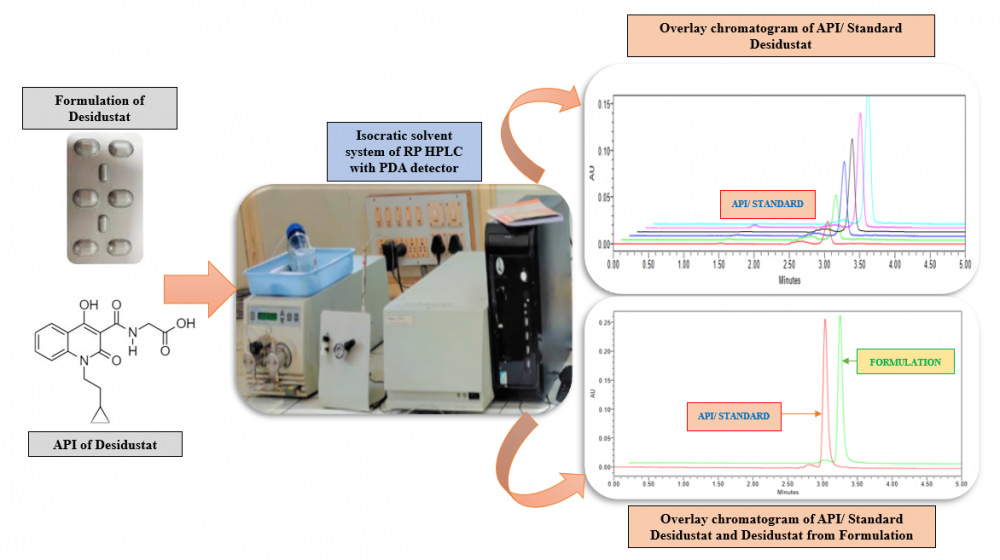
The hypoxia inducible factor prolyl hydroxylase inhibitor Desidustat is used to treat anemia linked to chronic kidney disease (CKD). For the estimation of Desidustat in bulk and commercial tablet formulation known as Oxemia, a precise, accurate, and sensitive reverse phase HPLC method has been developed and validated. The method described here was optimised with a Hypersil C18 (250 × 4.6 mm, 5 µm) column serving as the stationary phase and a mobile phase that included methanol: acetonitrile (80:20 v/v) added to the column at a flow rate of 1 mL/min. Using a photo diode array detector, Desidustat was detected at an analytical wavelength of 230 nm. With a correlation coefficient of 0.9989, the developed method was found to be linear in the concentration range of 1–6 µg/mL. Every parameter listed in the in International Conference on Harmonisation of Technical Requirements for Registration of Pharmaceuticals for Human Quality 2 (Revision 1) guideline was verified for the described method.
DOI http://doi.org/10.25135/jcm.95.2307.2839 Keywords Desidustat HPLC method validation DETAILS PDF OF ARTICLE © 2023 ACG Publications. All rights reserved.8) Comparison between top-down and bottom-up approaches in the estimation of measurement uncertainty in Bisphenol A analysis by HPLC-FLD
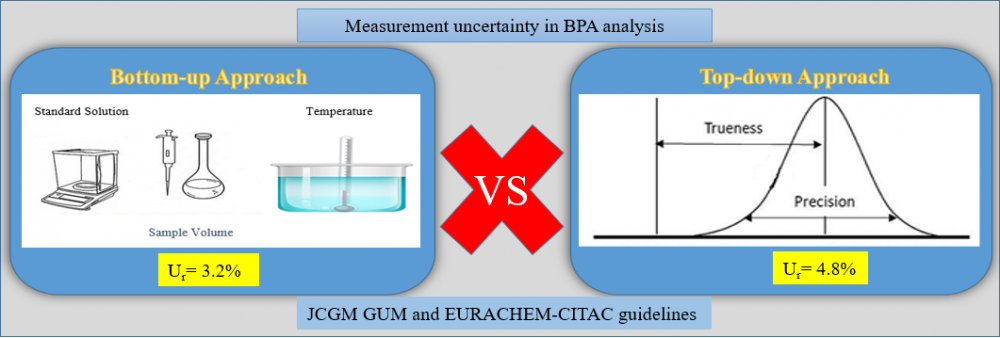
Measurement uncertainty is a metrological concept that characterizes distributions/variations that can make the measurement results logical and is linked to the result of the measurement. The measurement uncertainty of the method was estimated using two basic approaches (top-down and bottom-up approach). The top-down approach covers in-house validation data (trueness, repeatability and intra-lab reproducibility), while the bottom-up approach involves individual contributions to all uncertainty at each stage of the analysis/process. We estimated measurement uncertainty of BPA analysis by HPLC-FLD test according to JCGM GUM and EURACHEM-CITAC guidelines. The relative expanded uncertainties at the BPA concentration by the bottom-up approach and top-down approaches were ±3.2% and ±4.8% respectively (95% confidence interval, k=2). Thus, although it is seen that the results of the two approaches are different in chromatographic BPA analysis, it is concluded that the measurement uncertainty related to BPA analysis, especially in food analysis laboratories, can be determined by a simpler top-down approach.
DOI http://doi.org/10.25135/jcm.95.2308.2862 Keywords Bisphenol A measurement uncertainty bottom-up approach top-down approach HPLC-FLD DETAILS PDF OF ARTICLE © 2023 ACG Publications. All rights reserved.9) Gradient reversed-phase HPLC method for the quantitation of azelnidipine and chlorthalidone in a fixed-dose synthetic mixture
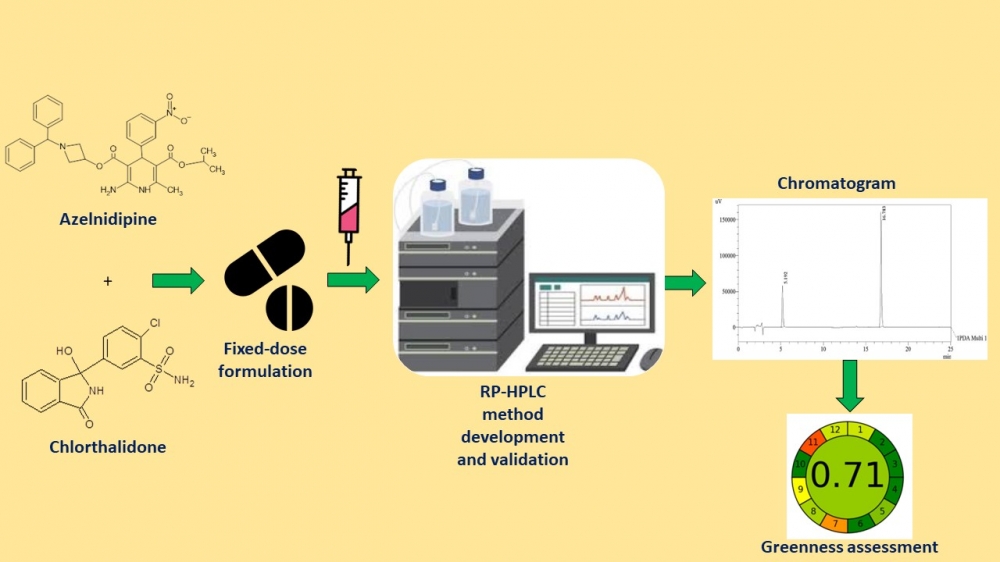
Fixed-dose drug combinations promote compliance and optimize prescription schedules. Recently, the FDA approved a film-coated tablet containing azelnidipine (8 mg) and chlorthalidone (6.25 or 12.5 mg) for the treatment of hypertension. A novel gradient mode high-performance liquid chromatography (HPLC) technique was developed and rigorously validated to enable the routine analysis of a fixed-dose combination. Materials and Methods: The stationary phase employed in this study was a Phenomenex Luna C8 column (250 × 4.6 mm, 5 µm particle size). The mobile phase consisted of a mixture of acetonitrile and water, with the addition of 0.1 percent formic acid, employed in a gradient mode. A typical detection wavelength of 256 nm was utilized for both compounds. The validation of this method adhered to the performance parameters outlined in the ICH Q2 (R1) guidelines. Results: This method successfully analyzed azelnidipine (99.58% w/w) and chlorthalidone (100.25% w/w) in a synthetic mixture prepared from their respective commercial tablet formulations. This process was executed to ensure the absence of plagiarism in the revised text. Conclusion: Thus, the technique inferred is ideal for routine examination of fixed-dose tablet formulation.
DOI http://doi.org/10.25135/jcm.100.2311.2977 Keywords Azelnidipine chlorthalidone hypertension liquid chromatography synthetic mixture DETAILS PDF OF ARTICLE © 2023 ACG Publications. All rights reserved.10) A new HPLC-UV method for the simultaneous measurements of α-escin and β-escin in creams containing Aesculus hippocastanum L. extract
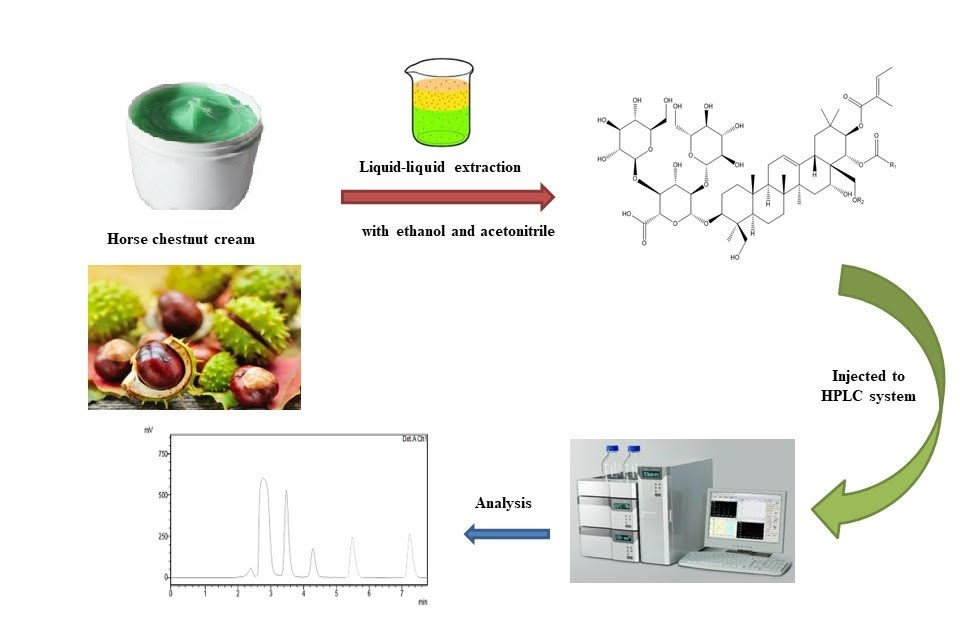
Amount of α-escin and β-escin in cosmetic cream formulations were determined by simple reverse phase HPLC method by using the C18 column at 228 nm. The mobile phase is composed of acetonitrile-water (60:40) at pH 2.4. The method validation study was carried out based on the ICH recommendations and linear regression equations were determined as y=1548.3x+340.7 and y=1521.3x-91.9, for the analytes, respectively. While LOD values of the method were determined for α-escin and β-escin as 0.003 µg/mL and 0.027 µg/mL, LOQ values were determined as 0.01 µg/mL and 0.08 0.01 µg/mL, respectively
DOI http://doi.org/10.25135/jcm.101.2310.2985 Keywords Horse chesnut α-escin β-escin HPLC-UV Validation DETAILS PDF OF ARTICLE © 2023 ACG Publications. All rights reserved.